Have you ever wondered if there’s a dynamic solution to the relentless challenge of data partitioning in the world of data lakehouses?
Well, I did! So let’s talk about it.
The Challenge of Fixed Data Layouts
Have a look at this graph.
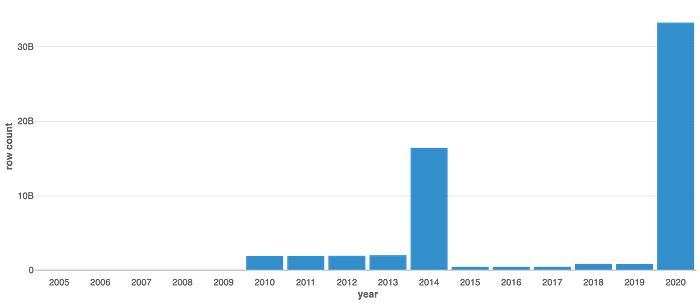
Yearly row counts for kaggle_partitioned table
This graph projects yearly row counts for a table & reveals a significant skew in data distribution. This skew is particularly relevant as consumers frequently employ the year column as a filter in their queries.
This table, when created, was partitioned using year and month columns. This is how the DDL looks like for this one.
%sql
CREATE TABLE kaggle_partitioned (
  year_month STRING,
  exp_imp TINYINT,
  hs9 SMALLINT,
  Customs SMALLINT,
  Country BIGINT,
  quantity BIGINT,
  value BIGINT,
  year STRING,
  month STRING
) USING delta PARTITIONED BY (year, month);
The problem here is, that 2 partitions have ~83% of the total data for the table.
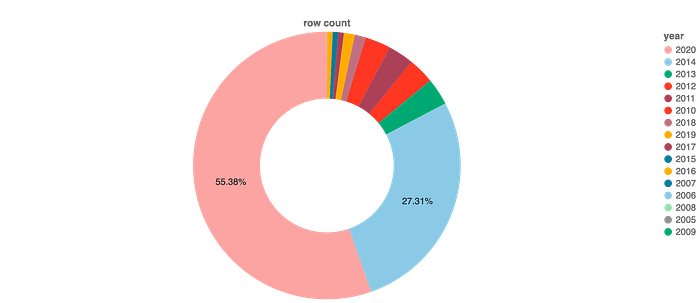
Data split yearwise
Based on the information provided above, do you think the table is under partitioned? Or is over partitioned?
Let’s look at the data distribution in further depth for this table. The following chart present the monthly split for each yearly row counts.